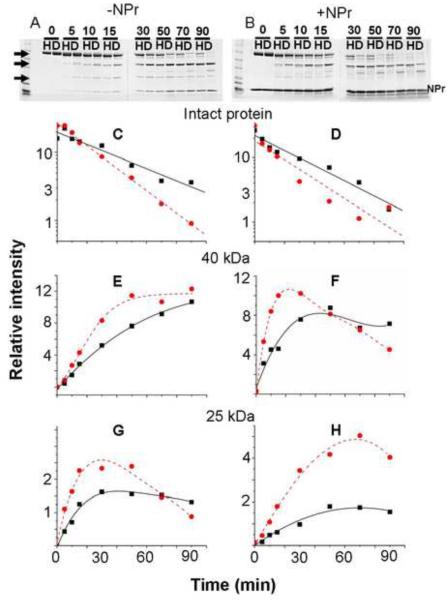
Fig. 2. Limited proteolysis of EINtr.
Approximately 65 μg of either H-EINtr(H356A) or D-EINtr(H356A) was incubated with 0.1 μg trypsin in 10 mM Tris·Cl (pH 8), 100 mM NaCl, 2 mM β-mercaptoethanol, 1 mM EDTA and 10 % glycerol in a total volume of 75 μl at room temperature. A companion incubation mixture was supplemented with 56 μg of NPr 1–85. At the indicated times (0 to 90 mins, shown above the lanes), 7.5 μl aliquots were removed and mixed with 7.5 μl of 2× Laemmli sample buffer. The samples were run on 4–20% SDS-PAGE gradient gels (Invitrogen), then stained with Coomassie Blue R250 (panels A & B). Lanes labeled H correspond to H-EINtr and those labeled D correspond to D-EINtr. The stained gels were scanned in an Odyssey near infrared fluorescence scanner (Li-Cor Biosciences) and then the fluorescence of Coomassie Blue [41] was quantitated by the Odyssey software. The intensity of the bands (panels C through H) were measured after subtraction of the background of the gels. Panels C & D, patterns of the degradation of the intact protein, designated by the topmost arrowhead on the left side of panel A; panels E & F, relative amounts of the ~40 kDa peptide (identified as including residues 170–523, mass of 39,794.4, see fig. 2), designated by the center arrowhead; panels G & H, relative amounts of the ~25 kDa peptide (G524-L748, see fig. 2), designated by the lowest arrowhead. Solid lines with squares = H-EINtr; dashed lines with circles = D-EINtr.Panels A, C, E, and G correspond to proteolysis in the absence of NPr; panels B, D, F and H correspond to proteolysis in the presence of NPr.

