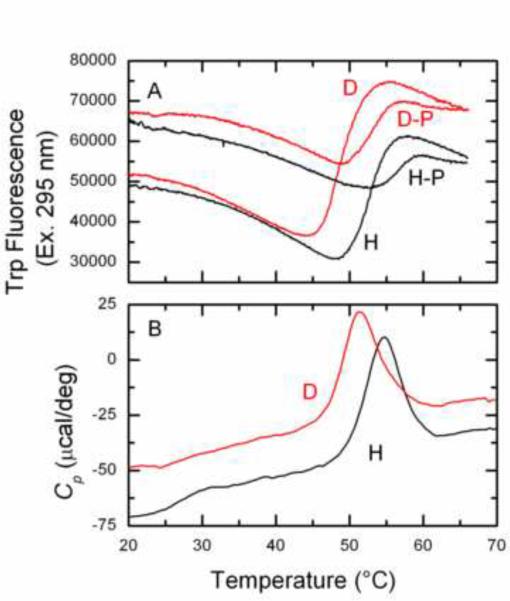
Figure 3. Thermal unfolding of EINtr.
Panel A: Thermally induced changes in fluorescence. EINtr(H356A) in the H and D forms (25 μg/ml) in 20 mM Tris·Cl (pH 8), 2 mM MgCl2, 5 mM NaCl, 0.1 mM β-mercaptoethanol, 0.05 mM EDTA and 0.5% glycerol in a total volume of 1 ml were scanned through the indicated temperature range at a scan rate of 30 °C/h. Where indicated (H–P and D–P), the samples also contained 150 μM PEP. Excitation was at 295 nm and emission at 340 nm. Panel B: DSC scans (see Materials and Methods) of EINtr(H356A) H and D forms. The proteins were dialyzed against 10 mM NaPO4, pH 8 and adjusted to a concentration of 300 μg/ml.

