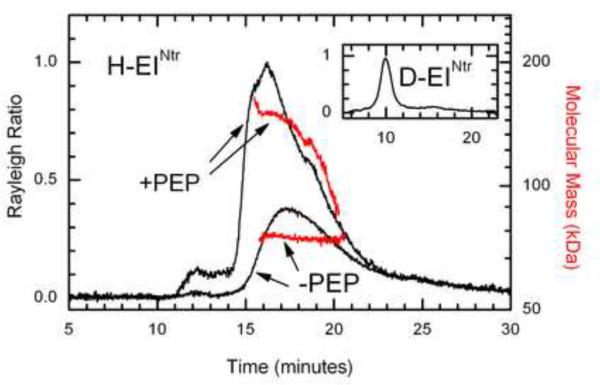
Figure 4. Oligomerization state of EINtr.
Light scattering analysis of H-EINtr was carried out as described in Materials and Methods. The gel filtration column was equilibrated with 20 mM Tris pH 8, 2 mM MgCl2, 150 mM NaCl. 100 μl of protein at 0.5 mg/ml was injected. When the protein was run in the presence of PEP, the column was pre-equilibrated with the buffer described above supplemented with 150 μM PEP. An aliquot (100 μl of protein at 0.5 mg/ml in the PEP supplemented buffer) was injected onto the column. The masses of the different regions (denoted by the red line) of the eluate were determined. Inset: Light scattering analysis of D-EINtr. A 100 μl sample of protein (0.5 mg/ml) was injected onto the column equilibrated with the Tris, MgCl2, NaCl buffer described above. The horizontal scale is time and the vertical scale is light scattering intensity.

