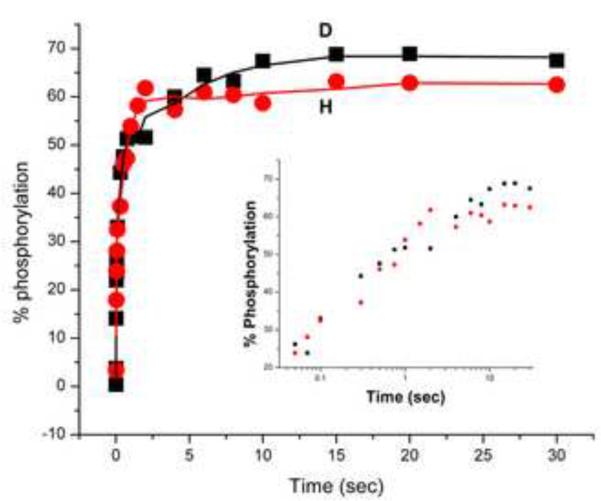
Figure 6. Autophosphorylation of EINtr.
Preliminary autophosphorylation experiments (with 5 and 10 min incubation periods) were carried out to determine the maximum autophosphorylation of EINtr stocks of the dephosphorylated (see Materials and Methods) H and D forms. Kinetic studies were carried out as described in Methods. Filled circles, H-EINtr; filled squares, D-EINtr. The inset to the figure displays the same data with the time scale plotted logarithmically to clarify the kinetics.

