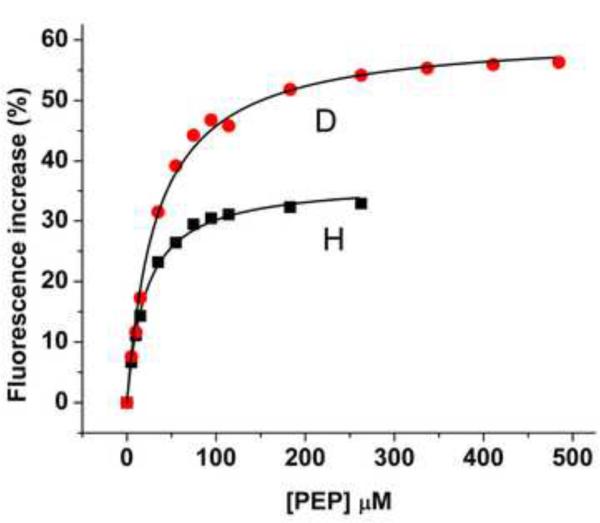
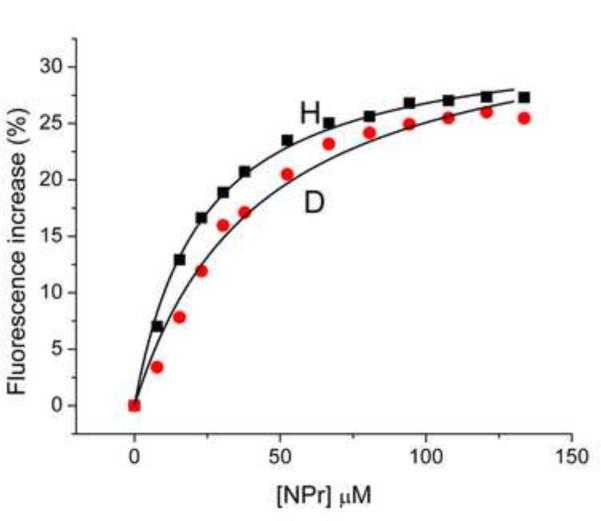
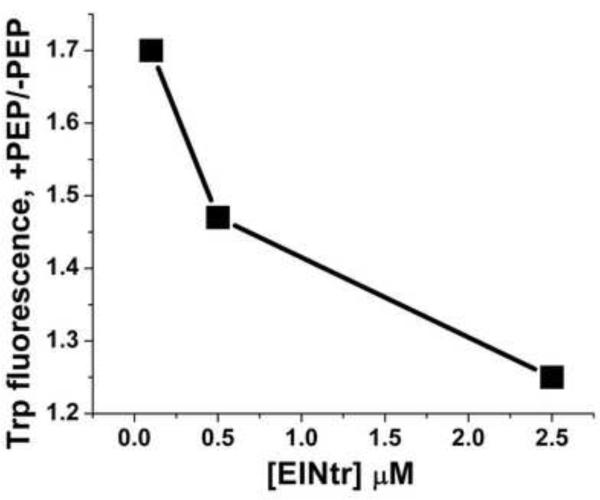
Figure 8. Effect of PEP and NPr concentration on EINtr fluorescence.
(A) PEP titration: Reaction mixtures (1 ml volume) contained: Tris·Cl, pH 8, 20 mM; MgCl2, 2 mM, EINtr(H356A), 0.5 μM. The baseline fluorescence intensities were: H, 4960; D, 5150. Fluorescence at 340 nm was measured at 37 °C after the indicated additions of PEP. The increase in fluorescence is plotted against the PEP concentration. An incubation mixture without added EINtr showed little fluorescence and no change in fluorescence after addition of PEP (data not shown). H form, squares; D form, circles. The measured fluorescence intensities were expressed as the % increase in fluorescence over the baseline. (B) NPr titration: Reaction mixtures (1 ml volume) contained: Tris·Cl, pH 8, 20 mM; MgCl2, 2 mM, EINtr(H356A), 0.5 μM. The baseline fluorescence intensities were: H, 5985; D, 4986. Fluorescence at 340 nm was measured at 37 °C after the indicated additions of NPr. The increase in fluorescence is plotted against the NPr concentration. An incubation mixture without added EINtr showed some fluorescence change after addition of NPr (data not shown). NPr has no Trp or Tyr residues but does have 3 Phe residues. The sequence is: MTVKQTVEITNKLGMHARPAMKLFELMQGFDAEVLLRNDEGTEAEANSVIALLMLDSA KGRQIEVEATGPQEEEALAAVIALFNS. The data were corrected for this change due to the NPr fluorescence. H-EINtr, filled squares; D-EINtr, open circles. The measured fluorescence intensities were expressed as the % increase in fluorescence over the baseline. (C) Effect of H-EINtr concentration on the PEP-dependent fluorescence change. Experimental conditions were as described above, except that PEP, where added, was at 2 mM. The EINtr(H356A) concentration was varied, as indicated.


