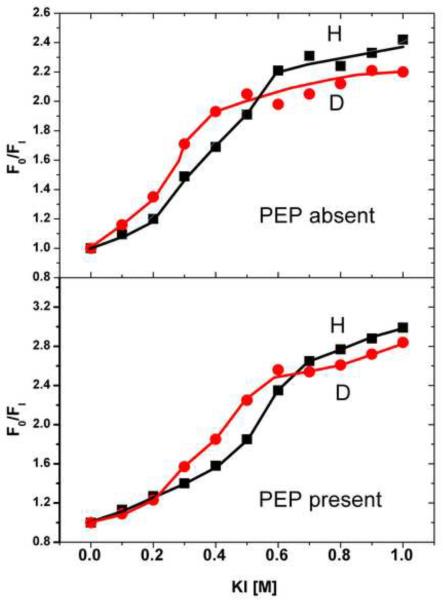
Figure 9. Iodide quench of the fluorescence of EINtr.
Incubation mixtures (150 μl total volume) contained Tris·Cl, pH 8, 20 mM; KI and KCl, the sum of which was always 1 M; and EINtr(H356A) in the H form (0.98 μM) or D form (1.36 μM). Fluorescence was measured with excitation at 295 nm and emission at 340 nm. Fluorescence quenching was analyzed according to the Stern-Vollmer relationship (F0/F1) [35] where F0 is the fluorescence in the absence of quencher and F1 is the fluorescence in the presence of the indicated quencher concentration. Filled circles, D-EINtr; filled squares, H-EINtr. Upper panel, absence of PEP; lower panel, presence of 2 mM PEP and 2 mM MgCl2.

