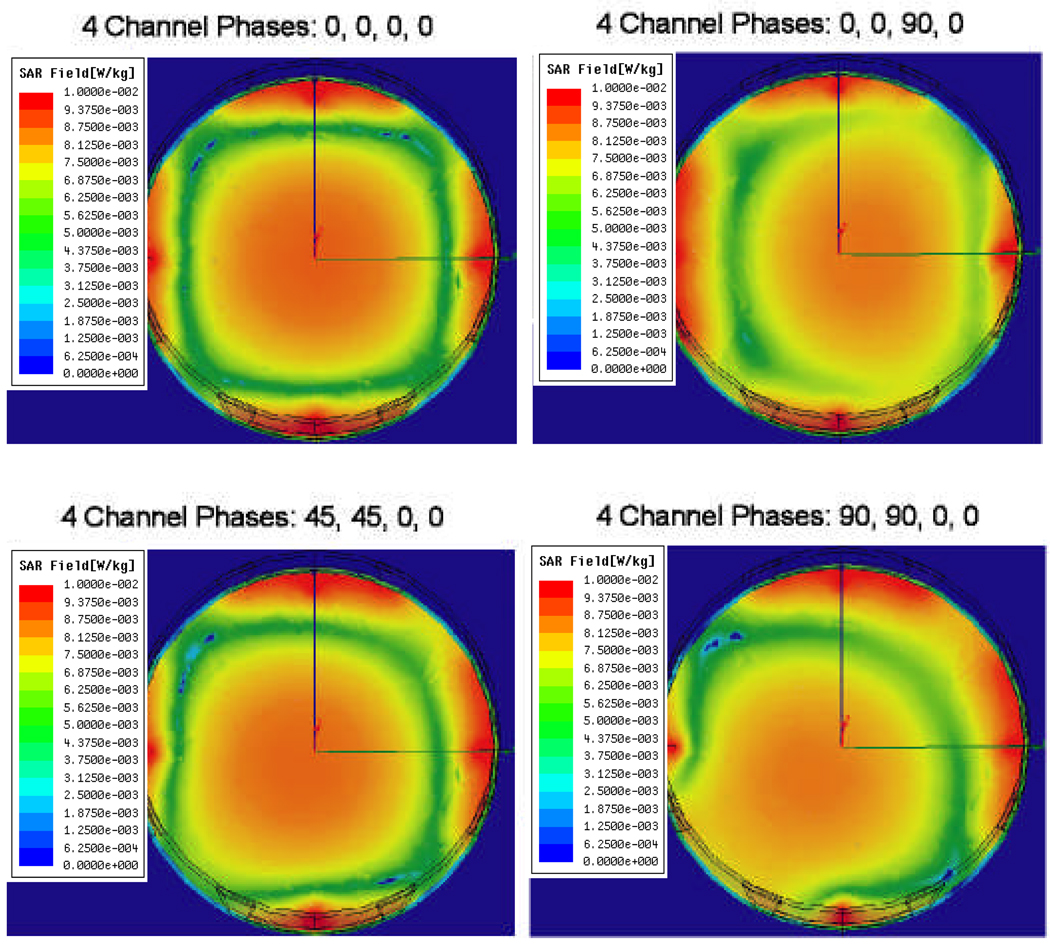
Figure 7.
HFSS simulation results in the x–y plane (X: horizontal; Y: vertical) for four different combinations of relative phase of the four MAPA antennas which produce movement of the SAR peak either horizontally to the right or diagonally towards lower left. Higher SAR is shown in orange. Relative phases are labeled at top.

