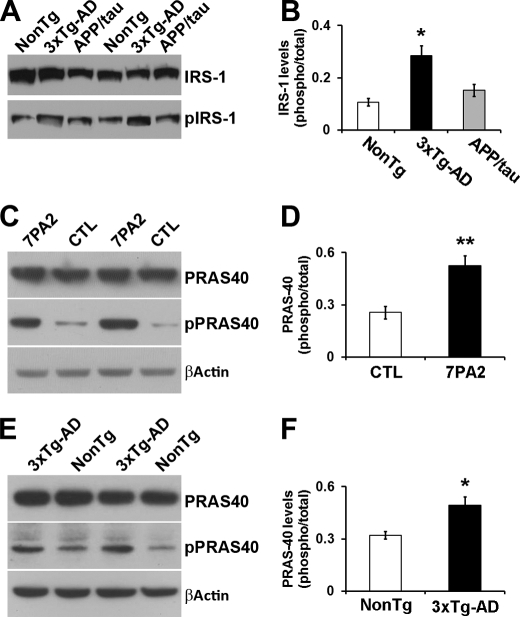
FIGURE 5.
Phosphorylation of PRAS40 is significantly increased in the hippocampi of 3xTg-AD mice. A, representative Western blots of protein extracted from 6-month-old NonTg, 3xTg-AD, and APP/Tau mice and probed with the indicated antibodies (n = 6/genotype). B, quantitative analysis of the blots indicates that the ratio pIRS1/IRS1 was significantly increased in 3xTg-AD mice when compared with NonTg mice and APP/Tau mice. No difference was detected between the NonTg and APP/Tau mice. C, representative Western blots of protein extracted from 7PA2 and control (CTL) CHO cells and probed with the indicated antibodies (n = 6/group). D, quantitative analyses of the blots indicate that phosphorylation of PRAS40 at Thr-246 (indicated as the ratio of total over phosphorylated levels) was significantly increased in the 7PA2 cells when compared with control cells. E, representative Western blots of protein extracted from the hippocampi of 6-month-old 3xTg-AD and NonTg mice and probed with the indicated antibodies (n = 6/group). F, quantitative analyses of the blots indicate that phosphorylation of PRAS40 at Thr-246 (indicated as the ratio of total over phosphorylated levels) was significantly increased in the hippocampi of the 3xTg-AD mice when compared with NonTg mice. Data are presented as means ± S.E. *, p < 0.05. **, p < 0.01.

