
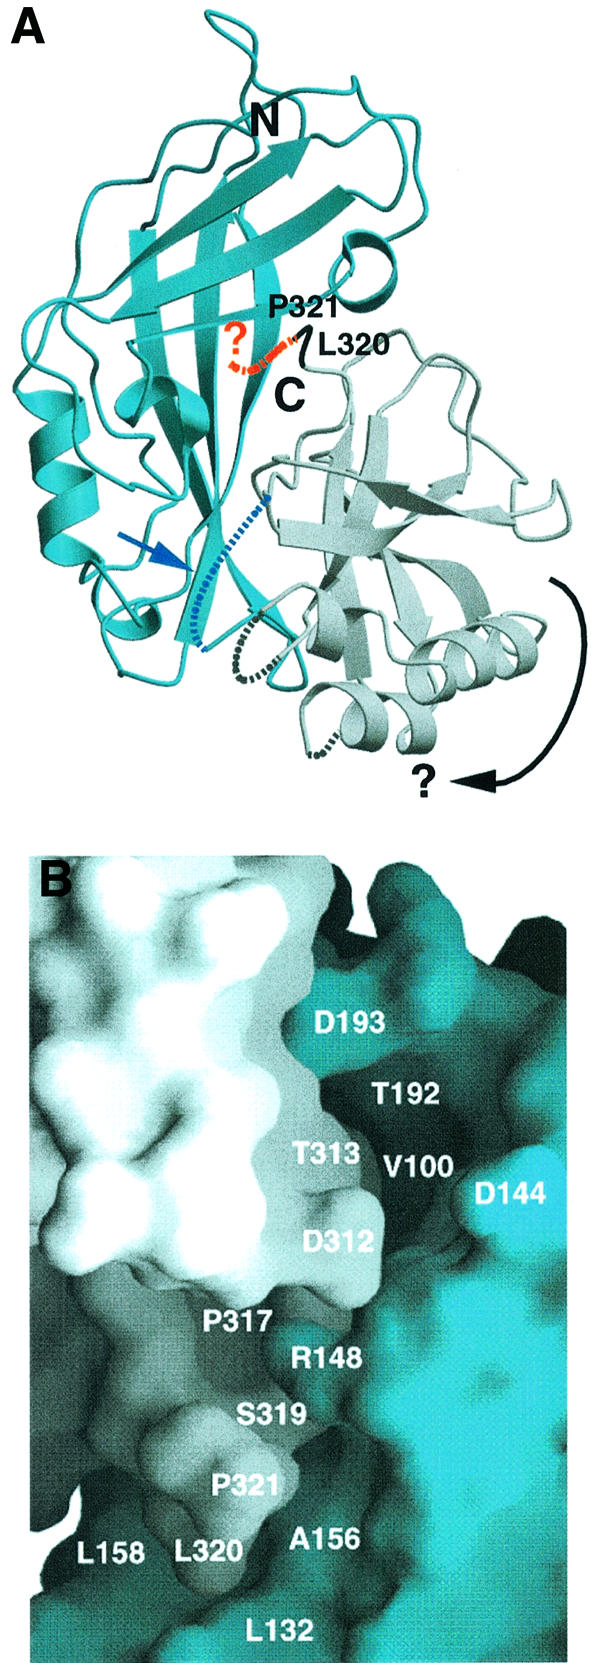
Fig. 1. Ribbon diagram [generated with the program Molscript (Kraulis, 1991)] and surface representation of VP40 [generated with the program Grasp (Nicholls et al., 1991)]. The N-terminal domain is shown in blue and the C-terminal domain in gray. (A) C-terminal residues L320 and P321 are shown in black, and the disordered residues 322–326 are indicated as a red dashed line. Three other disordered loop regions, including the connection between the N- and C-terminal domains, are also shown as dashed lines. The connection between the N- and C-terminal domains may constitute a hinge region (blue arrow and dashed line) and may allow the rotation of the C-terminal domain (indicated by a black arrow), thus opening up potential hexamerization interfaces. (B) Close-up of the interface of the N- and C-terminal domains around the position of P321. This view shows VP40 rotated anti-clockwise by 180° compared with the one shown in (A). Residues lining potential pockets for the binding of small molecule(s) at the interface are indicated (L132 and P317 are part of an ∼14 × 7 × 6.5 Å deep pocket, and V100 and T192 are at the bottom of an ∼8 × 8 × 10 Å deep pocket). Removal of residues 320–326 leads to spontaneous hexamerization of VP40(31–319) and to membrane binding in vitro.