
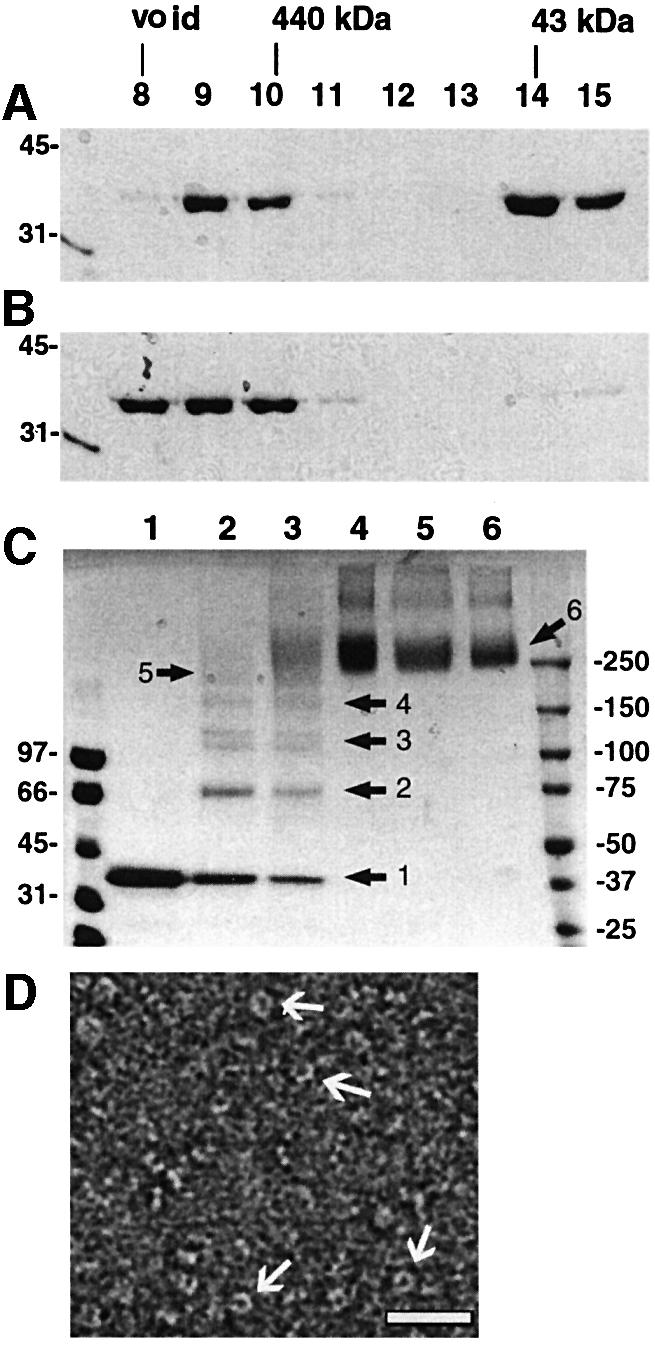
Fig. 2. (A) Gel filtration profile of VP40(31–319). Samples of fractions corresponding to elution volumes of 8–15 ml were separated by 12% SDS–PAGE and stained with Coomassie Blue. (B) Gel filtration profile of VP40(31–319) after incubation in 1 M urea. Molecular weight markers and the position of the elution of molecular weight markers from the gel filtration column are indicated. (C) Chemical cross-linking of VP40(31–319) (fraction 10, A). Lane 1, no cross-linking reagent; lane 2, 0.05 mM EGS; lane 3, 0.1 mM EGS; lane 4, 0.5 mM EGS; lane 5, 1 mM EGS; lane 6, 5 mM EGS. Molecular weight standards and the positions of intermediate cross-linking products are indicated. The samples were separated by 5–12% gradient SDS–PAGE and bands were visualized by Coomassie Blue staining. (D) Electron micrographs of VP40(31–319); the protein was stained with 1% SST and photo graphed under low-dose conditions. Several ring structures with an outer diameter of ∼90 Å are indicated by arrows. These micrographs were used for the 3D reconstruction. The white bar corresponds to 300 Å.