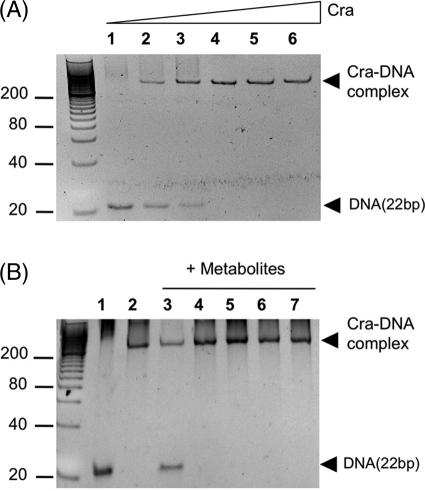
FIGURE 2.
Nonradioactive EMSA of Cra and its binding site in the intergenic fruR/fruBKA region of P. putida. A, EMSA experiment with increasing concentrations of pure Cra protein. Molar ratios of DNA:Cra were 1:0 (lane 1), 1:0.5 (lane 2), 1:1 (lane 3), 1:2 (lane 4), 1:4 (lane 5), and 1:8 (lane 6). B, Cra effector identification. DNA (0.75 μm) was incubated with pure protein (1.5 μm) in the presence of 1 mm of different metabolites: F1P (lane 3), FBP (lane 4), F6P (lane 5), G6P (lane 6), and fructose (lane 7). Lanes 1 and 2 correspond to DNA in the absence and presence of Cra, respectively, without any added metabolite. Note that only F1P prevents the binding of the protein to DNA.

