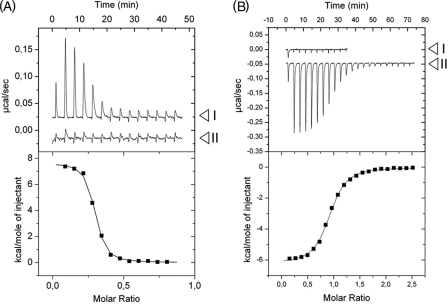
FIGURE 4.
ITC assays with Cra, effectors, and DNA. The upper panels plot raw data from representative ITC experiments, whereas the lower panels show the fitted curves of the same results but integrated and corrected for dilution. A, titration of Cra protein with DNA in the absence (I) and presence (II) of F1P. Positive peaks represent an endothermal event. Note that no interaction between Cra and the DNA is detected in the presence of F1P. The thermodynamic values calculated for protein-DNA interaction were KD = 26.3 ± 3.1 nm, ΔH = 7.66 ± 0.09 kcal/mol, TΔS = 17.68 ± 0.15 kcal/mol, and ΔG = −10.02 ± 0.10 kcal/mol. B, titration of Cra protein with (I) FBP and (II) F1P. The experiment covered concentrations of the effectors in the chamber ranging from 300 nm to 20 μm. Note that only the titration with F1P produces a heat change in the experiment at the tested concentrations. Negative peaks are indicative of an exothermic event. The thermodynamic values calculated by curve fitting were KD = 209 ± 20 nm, ΔH = −5.94 ± 0.39 kcal/mol, TΔS = 3.16 ± 0.40 kcal/mol, and ΔG = −9.10 ± 0.06 kcal/mol. The sigmoidal shape of the binding curve allows determination of the protein-effector stoichiometry, which corresponds to the molar ratio (x axis in lower panel) at the point of inflection of the curve. In this case, such a molar ratio was 1:1, indicating that one molecule (calculated, 1.06 ± 0.06 molecules) of F1P interacts with one molecule of Cra monomer.

