FIGURE 7.
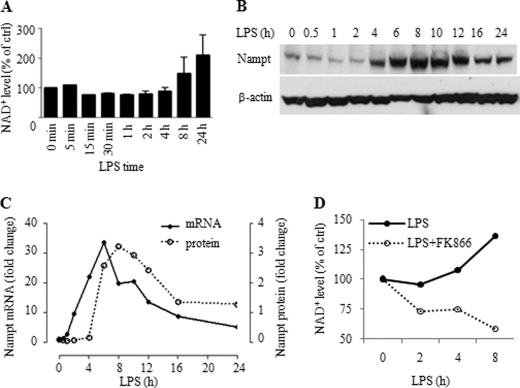
Nampt expression and cellular NAD+ increase during TLR4-induced endotoxin tolerance. A, changes in cellular NAD+ levels during the course of endotoxin tolerance. Cells were cultured for different times in the presence of 1 μg/ml LPS. Intracellular NAD+ was extracted and evaluated using a commercial kit as detailed under “Experimental Procedures”. Results are reported as mean ± S.E. of 3 independent experiments. B: Western blot analysis of Nampt expression at the indicated times after 1 μg/ml of LPS stimulation. C, Real-time PCR analysis of Nampt transcription after LPS stimulation and densitometry analysis of Nampt protein levels in B. D, Nampt inhibitor FK866 inhibits LPS-induced NAD+ biosynthesis and depletes cellular NAD+. THP-1 cells were cultured for the indicated times with 1 μg/ml LPS or LPS plus 10 nm FK866. Intracellular NAD+ was extracted and analyzed as in A.

