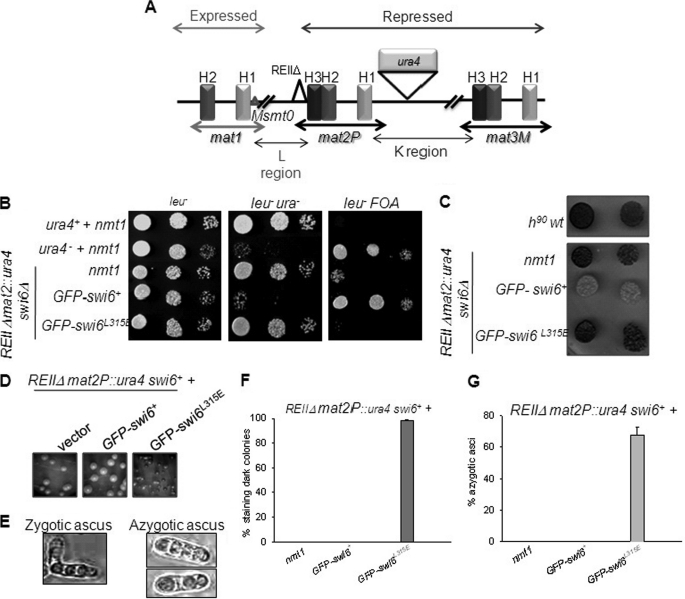
FIGURE 4.
The swi6L315E mutant gene is defective in complementing the silencing defect in swi6Δ mutant and exerts a dominant negative effect on silencing at the mat2 locus. A, diagrammatical representation of the mating-type region (1, 33). Switching the incompetent Msmt0 strain with a wild-type chromosomal copy of swi6 deleted (swi6Δ) and a ura4 reporter cassette inserted on the right side of mat2P, whereas a cis-acting repression element, REII, has been deleted (REIIΔ). The mat1M locus has a deletion of the cis-acting sequence Msmt0; such a strain does not undergo imprinting at mat1 and is thereby unable to switch and retains a stable Minus (M) mating type (1, 8). In combination with swi6Δ mutation, the strain exhibits a silencing defect, increased ura4 expression, and iodine staining (8, 10). B, the above strain was transformed with vector alone, nmt1-GFP-swi6+, and nmt1-GFP-swi6L315E mutant plasmids. Cultures of the transformants were serially diluted and spotted on plates lacking leucine (left panel), lacking leucine and uracil (center panel), or lacking leucine and containing fluoroorotic acid (right panel). Cultures of control ura+ and ura4− strains having the control vector were also spotted. After growth for 3–4 days at 30 °C, the plates were photographed. C, the colonies growing on plates lacking leucine in B were stained with iodine and photographed. D–G, the dominant negative effect of the swi6L315E mutant on silencing at the mat2 locus. D, the effect of the L315E mutant on silencing. The swi6+ strain above was transformed with vector (left panel), nmt1-GFP-swi6+ plasmid (center panel), and nmt1-GFP-swi6L315E plasmid (right panel). The transformants were streaked for single colonies on PMA plates lacking leucine. The colonies formed after 3–4 days of growth at 30 °C were stained with iodine and photographed. E, the haploid meiosis (azygotic ascus) phenotype observed in the right panel of D is shown on the right. F and G show, respectively, the quantitation of the number of iodine staining colonies, and the asci showing haploid meiosis in the transformants are shown in E.

