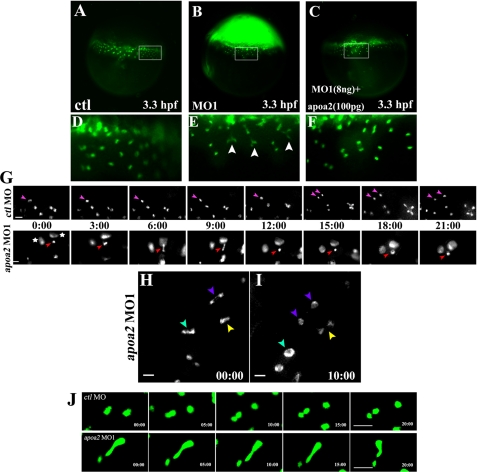
FIGURE 5.
Time-lapse imaging of the YSN division in apoa2 MO embryos. Injection with 8 ng of control MO or apoa2 MO1 or co-injection with 8 ng of apoa2 MO1 with human HDL (contains 100 pg of Apoa II) was performed at the 1-cell stage. At the 512-cell stage, SYTOX Green was injected. Images of embryos were taken at the 1k-cell-sphere stage (A–I). D–F denotes magnified views of the regions marked by rectangles in panels A–C. The YSN (labeled with SYTOX Green) showed severely defective nuclear division (indicated with white arrowhead) in apoa2 MO1-injected embryos (n = 31) (E) but did not emerge the phenotype in apoa2 MO1 and human HDL-co-injected embryos (n = 10) (F) compared with control embryos (n = 8) (D). G, progression of complete and incomplete division of the YSN were captured in the control embryo and apoa2 MO1-injected embryo, respectively. The pink arrow indicates the normal dividing nucleus, and the red arrow indicates defective nuclear division. Images were taken every 3 min. The aggregated nuclei are indicated by an asterisk. H, I, real time tracing of three incompletely divided nuclei are shown in the apoa2 MO1-injected embryo. A severe defect in nuclear division is indicated with the cyan arrowhead, and medial and slight defects are indicated with purple and yellow arrowheads, respectively. H and I were intervals of 10 min. Scale bar, 20 μm. J, examples of real time tracing show YSN movements during the progression of YSL patterning. Upper panel: two nuclei moved apart, away from each other to disperse in the cytoplasm of YSL in ctl MO embryos. Lower panel: the two connected nuclei in apoa2 MO embryo underwent back and forth movement during the progression of YSL patterning. Scale bar, 50 μm.

