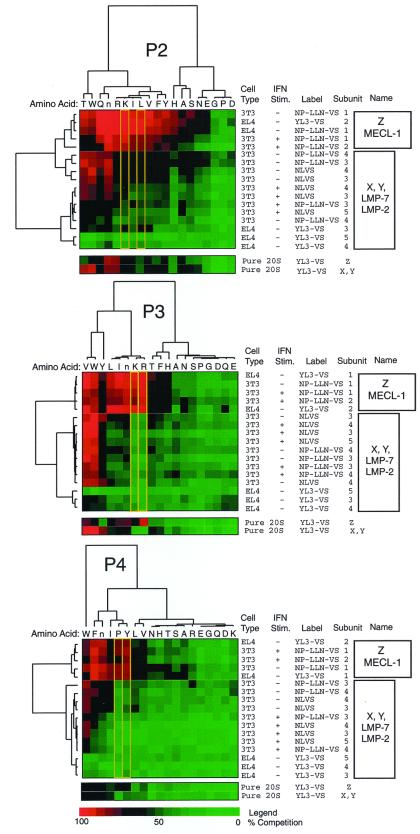
Figure 3.
Cluster analysis of the complete data set obtained for each positional scanning library. Percent competition data obtained from gels as shown in Fig. 2B was converted to color format as described in Experimental Methods. Multiple cell lines, conditions of stimulation, and labels were used for analysis in crude cell extracts and are indicated on the right. The tree structure at the top and left of the diagram was obtained by hierarchical clustering and indicates the degree of similarity as a function of the height of the lines connecting profiles. Subunits are numbered according to the bands labeled in Fig. 2B, and the boxed regions to the far right indicate groups of high similarity across the series of constant amino acids. Note the similarity and clustering of the Z and MECL-1 subunit profiles (subunits 1 and 2). Yellow boxes highlight amino acid residues at each position that show the greatest degree of selectivity for the Z and MECL-1 subunits over the X, Y, LMP-2, and LMP-7 subunits. Data from addition of scanning libraries to purified preparations of 20S proteasomes using the methods used for analysis in crude extracts are displayed at the bottom of the clustergrams for comparison.

