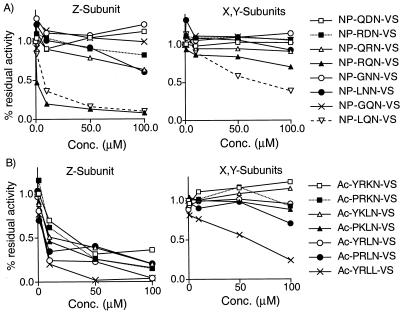
Figure 4.
Library validation and testing of Z-specific inhibitors designed from scanning data. (A) Competition analysis using single components selected based on data from the P2 and P3 positional scanning libraries. Data were obtained by addition of increasing concentrations of the indicated compounds to NIH 3T3 crude cell extracts. Intensity of labeled bands was measured for each concentration and expressed as a ratio to the control, nontreated lane. Residues for this study were chosen based on their overall activity against the multiple active sites of the proteasome. These include strong binding (R, L), weak binding (G, N, D), or positionally dependent strong binding (Q) amino acids. (B) Competition analysis as in A for the Z-subunit selective inhibitors designed based on the optimized residues outlined in Fig. 3. The non-P1 arginine compound Ac-YRLL-VS also is shown. Note the loss of selectivity upon conversion of the P1 amino acid to leucine.

