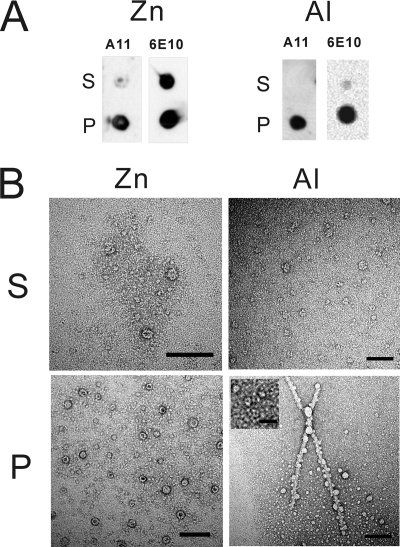
FIGURE 8.
The distribution of Zn2+- and Al3+-induced oligomers. The end point products of Aβ in the presence of 25 μm Zn2+ or 100 μm Al3+ were subjected to centrifugation. The oligomers were mostly precipitated in the pellets, as revealed by dot blotting (A) and TEM images (B). Supernatant and pellet were denoted as S and P. Annular protofibrils were observed predominantly. The scale bars for all images are 100 nm, except for the inset, which is 20 nm.

