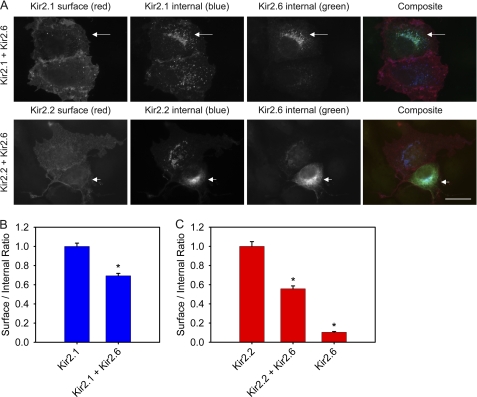
FIGURE 5.
Kir2.1 and Kir2. 2 are partially retained in the ER when coexpressed with Kir2.6 in COS-1 cells. A, cells were cotransfected with HA-Kir2.1 and GFP-Kir2.6 (upper panels) or Myc-Kir2.2 and GFP-Kir2.6 (lower panels). The cells were fixed 24 h later and labeled for surface expression of Kir2.1 or Kir2.2 with mouse anti-HA or rat anti-Myc, respectively. Then cells were permeabilized and labeled for internal expression of Kir2.1 or Kir2.2 with rat anti-HA or mouse anti-Myc, respectively. Total Kir2.6 in permeabilized cells also was labeled with rabbit anti-GFP. Pairs of cells with high or low Kir2.6 expression are shown in each image. Note that the cell of each pair with high Kir2.6 expression (arrow) displays correspondingly high internal expression of Kir2.1 or Kir2.2 that colocalizes with Kir2.6 and low surface expression of Kir2.1 or Kir2.2. Bar, 20 μm. B, the ratios of surface to internal expression were measured using anti-HA antibodies for HA-Kir2.1 expressed alone or HA-Kir2.1 when cotransfected with GFP-Kir2.6. The surface/internal ratios were normalized to the values for HA-Kir2.1 alone. C, the ratios of surface to internal expression were measured using anti-Myc antibodies for Myc-Kir2.2 expressed alone, Myc-Kir2.2 when cotransfected with GFP-Kir2.6, or Myc-Kir2.6 expressed alone. The surface/internal ratios were normalized to the values for Myc-Kir2.2 alone. For each condition, n = 100. The error bar indicates ± S.E. *, statistically significant when compared with Kir2.1 or Kir2.2 (p < 0.0001).

