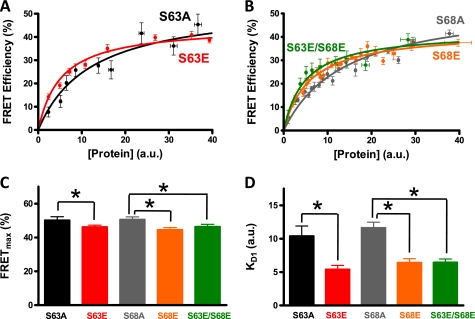
FIGURE 3.
Effects of phosphomimetic mutations on PLM-PLM FRET. A, concentration dependence of FRET for S63A (black circles) and S63E (red circles). a.u., arbitrary units. B, concentration dependence of FRET for S68A (gray circles), S68E (orange circles), and S63E/S68E (green circles). The concentration dependence of FRET was well described by a hyperbola of the form FRET = FRETmax[protein]/(KD1 + [protein]). C and D, mean FRETmax and KD1 parameters, respectively, obtained by hyperbolic fitting of data from multiple independent experiments. Values are means ± S.E. *, p < 0.05 versus S63A or S68A.

