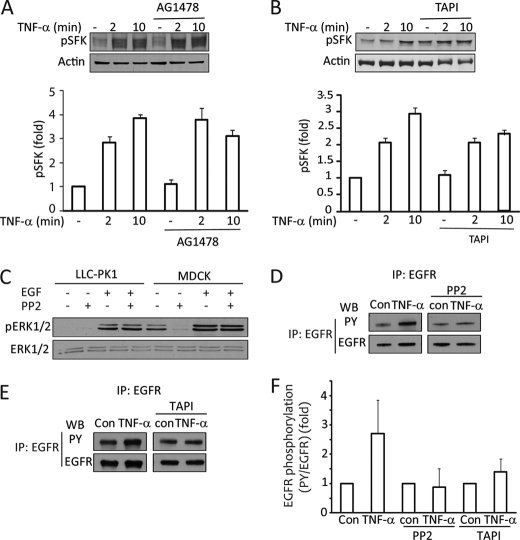
FIGURE 6.
A and B, TNF-α-induced Src activation is upstream of the EGFR and TACE. LLC-PK1 cells were treated with 100 nm AG1478 (A) or 10 μm TAPI-1 (B) before the addition of 10 ng/ml TNF-α for the indicated times. The cell lysates were probed using a phospho-SFK antibody. This antibody detects all Src family kinases phosphorylated at Tyr-416 (corresponding to activated SFK). The graph summarizes densitometric quantification (mean ± S.E. of n = 3 experiments). Actin was used to verify equal loading, as the total SFK antibody did not react with Src kinases in LLC-PK1 cells. C, EGF-induced ERK activation is independent of Src kinases. LLC-PK1 and MDCK cells were treated with PP2 and EGF as indicated, and pERK was detected as described earlier. D–F, TNF-α-induced EGFR activation requires Src and TACE. LLC-PK1 cells were transfected with EGFR. Cells were treated as indicated. EGFR was immunoprecipitated (IP), and phosphotyrosine (PY) and EGFR were detected as in Fig. 1. The graph in F shows densitometric analysis of three independent experiments, performed as described under “Experimental Procedures.” In each experiment the normalized phosphorylation was expressed as -fold increase from the corresponding untreated sample or the sample treated with TAPI-1 or PP2 alone. The blots shown in D and E are from the same experiment run on the same gel (D) or on separate gels (E). WB, Western blot.

