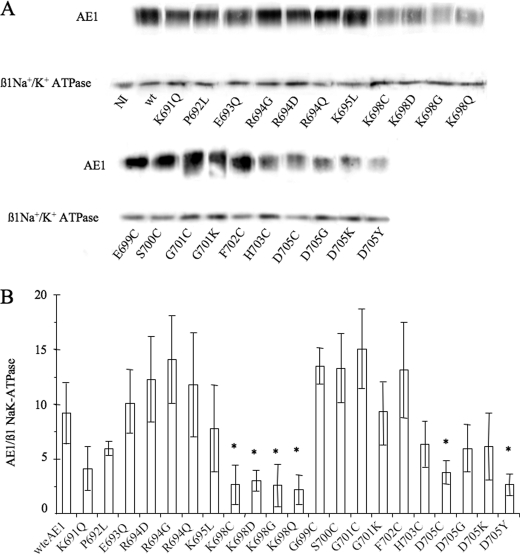
FIGURE 5.
Immunodetection of WT and mutant AE1. A, Western blots for immunodetection of AE1 in biotin-labeled oocyte plasma membrane samples (upper row). Primary antibody was an anti-N-terminal domain of AE1 1/10,000 (CDB3, kind gift from Dr. P. Low). Lower row, immunodetection of β1 Na,K-ATPase (43 kDa) in the same samples (primary antibody clone M17-P5-F11, 1/250; Sigma). The figure combines three Western blots, showing all of the different AE1 constructs. The Western blots were chosen according to their similarity with the quantification data shown in Fig. 5B. B, quantification of AE1 level in plasma membrane normalized to β1 Na,K-ATPase signal. After corresponding background subtraction, pixels corresponding to AE1 signal were divided by pixels corresponding to β1 Na,K-ATPase signal in the same biotin-labeled sample. Each bar is a mean ± S.E. (error bars) of at least three different Western blots corresponding to different batches of injected oocytes. Student's t test was performed comparing WT AE1 data with mutant AE1 data (*, p < 0.07).

