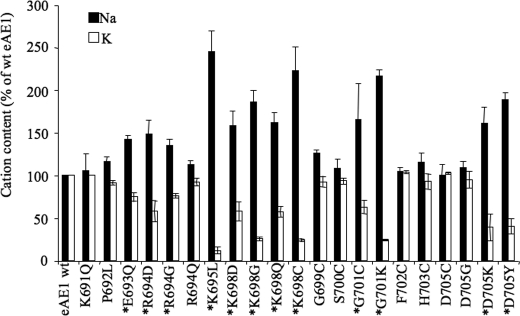
FIGURE 7.
Oocyte Na+ and K+ contents. Na+ and K+ contents of oocytes expressing WT or mutated AE1 are shown. Data are means ± S.E. (error bars) of at least three experiments. For each single experiment, measurements were done on triplicate for each condition and mean Na+ or K+ contents were expressed in percent of control oocytes (noninjected or expressing WT AE1). Student's t test was performed to compare data from mutant-expressing oocytes with WT-expressing oocytes (*, p < 0.07).

