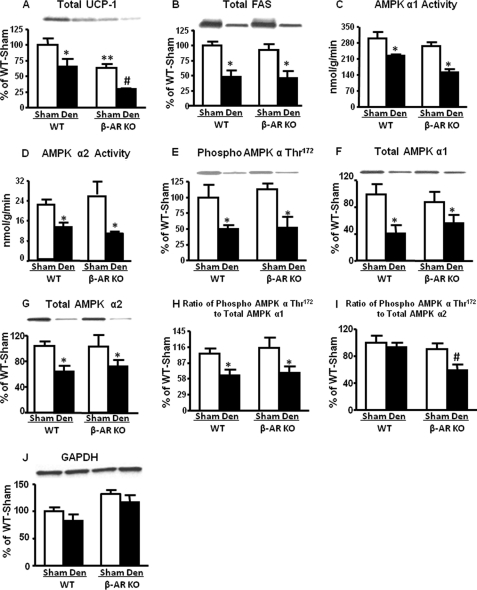
FIGURE 2.
Effect of denervation on UCP1 and fatty acid synthase protein levels and AMPK activity and α subunit Thr172 phosphorylation in the brown fat of 7–9-week-old male WT and β-AR KO mice. All data are 6 days after denervation (Den). UCP-protein (panel A), fatty acid synthase protein (panel B), AMPK activity (panel C and D), Thr172 phosphorylation of AMPK α subunit (panel E), total AMPK α1 and α2 (panel F and G), and the ratio of phosphorylated to total AMPK α (panel H and I) are shown. Protein levels are normalized to GAPDH (panel J). Data are expressed as the mean ± S.E.; n = 12 per group. *, p < 0.05 versus respective sham; #, p < 0.05 versus all groups; **. p < 0.05 versus WT sham. Food was withdrawn for 2 h before the sacrifice.

