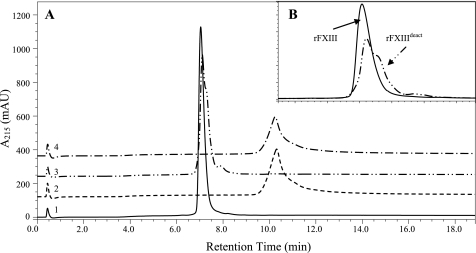
FIGURE 2.
AIEC traces from four rFXIII samples. A, rFXIII (trace 1), rFXIIIa° (trace 2), rFXIIIdeact (trace 3), and rFXIIIa° (trace 4). rFXIIIa° (trace 2) was produced by activation in 50 mm Ca2+, 37 °C, 1 h. rFXIIIdeact (trace 3) was produced by removal of Ca2+ from rFXIIIa°. rFXIIIa° from trace 4 was produced by reactivating rFXIIIdeact in Ca2+ similarly to rFXIIIa° in trace 2. B, enlargement of the area around the retention times of rFXIII and rFXIIIdeact (i.e. traces 1 and 3). rFXIII elutes as a one smooth peak whereas rFXIIIdeact seems to contain at least two components.

