FIGURE 2.
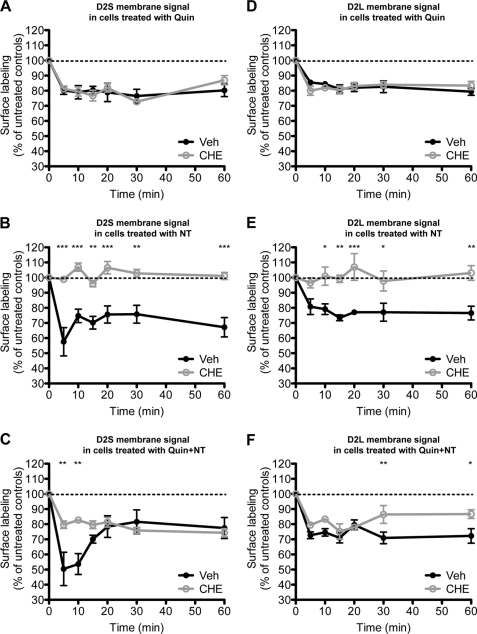
NT-induced D2R internalization in transfected HEK-293 cells is PKC-dependent. Time course of D2R internalization measured by ELISA as the loss of membrane signal. Black curves, vehicle pretreatment (Veh). Gray curves, chelerythrine pretreatment (CHE). A–C, internalization profile of the D2S in response to Quin, NT, and Quin+NT treatments, respectively. D–F, internalization profile of the D2L in response to Quin, NT, and Quin+NT treatments, respectively. *, p < 0.05; **, p < 0.01; ***, p < 0.001; two-way ANOVA with Bonferroni multiple comparison tests (n = 4–7 experiments).

