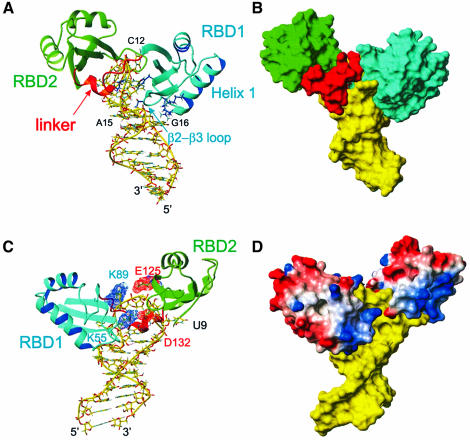
Fig. 3. Overall description of the complex. The lowest energy structure is shown. (A) Stick (RNA) and ribbon (protein) representation of the complex showing how the RNA loop is ‘sandwiched’ between the two RBDs. RBD1 is located in the major groove side of the RNA and contacts C12, G13 and the loop E motif. RBD2 is located on the minor groove side and contacts U9 and C10. The linker is mostly located in the minor groove side on the RNA. The amino acid side chains from RBD1 V27, K31 (α-helix 1) and T52, R54 (β2–β3 loop), which contact the stem, as well as the inserting residues F56 and K94, are shown in blue. (B) Surface representation of the RNA and protein complex. The view is the same as in (A). (C) View of the complex showing that the two RBDs interact via two salt bridges (K89–E125 and K55–D132). Asp and Glu are shown in red and Lys and Arg in blue. The major groove face of the binding site is shown. (D) GRASP (Nicholls et al., 1991) representation of the complex with positively charged residues in blue and negatively charged residues in red. The color scheme is the same as Figure 2, except for the GRASP representation.

An official website of the United States government
Here's how you know
Official websites use .gov
A
.gov website belongs to an official
government organization in the United States.
Secure .gov websites use HTTPS
A lock (
) or https:// means you've safely
connected to the .gov website. Share sensitive
information only on official, secure websites.
