
Table 4.
Rat LT model survival data for LFIs, experiment 2.
 | |||||||||
|---|---|---|---|---|---|---|---|---|---|
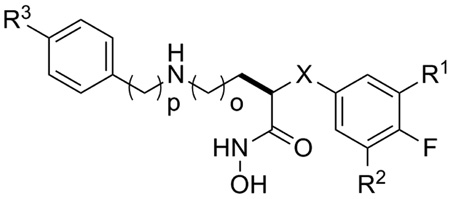
| LFI | Ki(nM) | X | R1 | R2 | R3 | o | p | 5.0 mg/kg |
|
| Survivala | rMST b | ||||||||
| 1b | 0.24 | NH | Me | Me | F | 3 | 1 | 2/4 | 17.0 |
| 5b | 0.13 | CH2 | Me | Me | F | 3 | 1 | 1/5 | 13.6 |
| 4b | 1.2 | O | Me | Me | F | 3 | 1 | 0/5 | 2.9 |
| 18 | 2.0 | O | Me | Me | Cl | 3 | 1 | 3/6 | 1.3 |
| 19 | 2.2 | NH | Me | Me | F | 3 | 3 | 1/5 | 2.0 |
| 20 | 4.6 | CH2CH(OMe) | H | H | F | 4 | 1 | 0/4 | 1.4 |
| 21 | 5.0 | CH2CH(OMe) | H | H | F | 4 | 2 | 0/4 | 1.3 |
| 22 | 3.1 | O | Me | Me | F | 4 | 1 | 0/3 | 1.4 |
| 23 | 3.3 | O | Me | Me | F | 4 | 2 | 0/3 | 1.1 |
Fischer 344 rats were dosed IV with LFIs followed 20 to 30 minutes later by 10µg of LT (10 µg PA + 10 µg LF) dosed IV.
a
Number of survivors per group. Survival curves for all LFIs except 23 versus controls showed statistical significance (P<0.05). When comparing curves for individual LFIs at 5.0 mg/kg, significance (P<0.05) was observed for 1b vs. 4b, 4b vs. 5b, and 4b vs. 22; but was not considered significant for 1b vs. 19, or 4b vs.18.
b
rMST = MST(LFI)/ MST(controls) where vehicle treated controls (MST = 70.7 ± 5.1 minutes, n=9); when less than 50% deaths occurred the average survival time was used: rMST = aveST(LFI)/MST(controls).