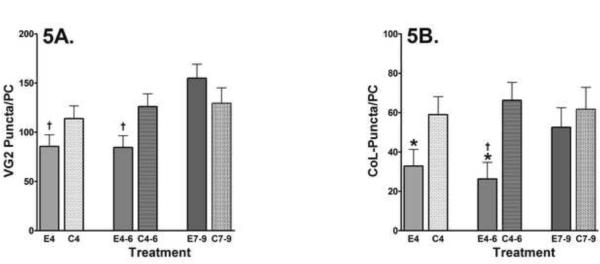
Figure 5.
Alterations in the number of puncta representing Climbing Fiber endings in the Molecular Layer region of Lobule I on PN40 following ethanol exposure at 4.5 g/kg during the early postnatal period. MRC40 = mother reared control group; C4, C4-6, C7-9 = Isocaloric vehicle control groups; E4, E4-6, E7-9 = Ethanol exposure groups; (see Table 1). Error bars represent SEM.
A. Total VGlut2 puncta present in the molecular layer region expressed on a per Purkinje cell basis. (VG2 Puncta/PC). There were no significant control group differences (F(3,20)=0.37; p > 0.05) that impact the conclusions. No significant interaction (F(2, 29) = 3.2; p>0.05) and no significant main effect of treatment (F(1,29) = 1.9; p>0.05) was identified. However a significant main effect of timing (F(2, 29) = 5.4; p<0.02) was observed. Custom contrasts at the p<0.05 level identified significant differences only for E4 vs E7-9 (†) and E4-6 vs E7-9 (†). MRC40 = 112.05 ± 12.0.
B. Total co-localized puncta present in the molecular layer region expressed on a per Purkinje cell basis. (CoL-Puncta/PC). There were no significant control group differences (F(3, 20)=0.17; p > 0.05) that impact the conclusions. A significant interaction (F(2, 29) = 3.7; p<0.05) was observed. Custom contrasts at the p<0.05 level identified significant differences for E4 vs C4 (*), E4-6 vs C4-6 (*), and E4-6 vs E7-9 (†). MRC40 = 56.27 ± 9.48.

