Figure 7.
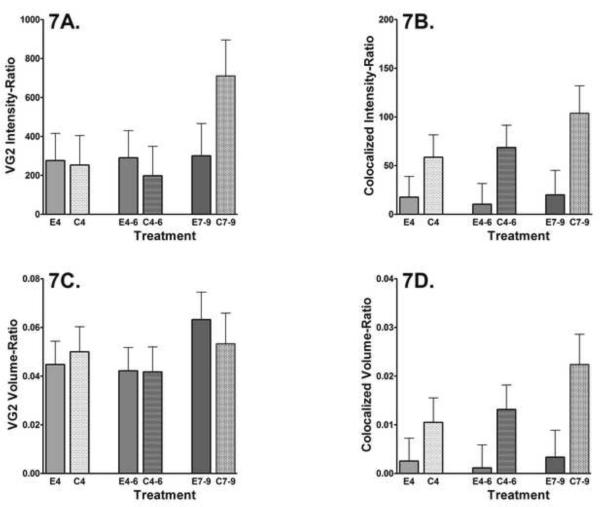
Alterations in Climbing Fiber endings in the Soma region of Lobule I on PN40 following ethanol exposure at 4.5 g/kg during the early postnatal period. MRC40 = mother reared control group; C4, C4-6, C7-9 = Isocaloric vehicle control groups; E4, E4-6, E7-9 = Ethanol exposure groups; (see Table 1). Error bars represent SEM.
A. VGlut2 expression intensity relative to total PC tissue volume (VG2 Intensity-Ratio). There were no significant control group differences (F(3, 20)=1.30; p > 0.05) that impact the conclusions. MRC40 = 264.68 ± 155.05. There was no significant interaction (F(2,29)=1.3; p>0.05) and no significant main effect of treatment (F(1,29) <1) or timing (F(2,29) = 1.5; p>0.05).
B. Alterations in the Co-localized expression intensity relative to total PC tissue volume (Co-localized Intensity-Ratio). There were no significant control group differences (F(3, 20)=0.27; p > 0.05) that impact the conclusions. There was no significant interaction (F(2,29) <1) and no significant main effect of treatment (F(1,29) <1) or timing (F(2,29) = 1.1; p>0.05). MRC40 = 74.05 ± 28.2.
C. Alterations in the VGlut2 expression volume relative to total PC tissue volume (VG2 Volume-Ratio). There were no significant control group differences (F(3, 20)=0.41; p > 0.05) that impact the conclusions. No significant interaction (F(2, 29) < 1) and no significant main effect of treatment (F(1,29) <1) or timing (F(2, 29) <1) were present. MRC40 = 0.06 ± 0.01.
D. Alterations in relative Co-localized expression volume relative to total PC tissue volume (Co-localized Volume-Ratio). There were no significant control group differences (F(3, 20)=0.39; p > 0.05) that impact the conclusions. No significant interaction (F(2, 29) < 1) was observed. A significant main effect of treatment (F(1,29) = 9.4; p<0.01) with no significant main effect of timing (F(2, 29) <1) was present. MRC40 = 0.02 ± 0.006.

