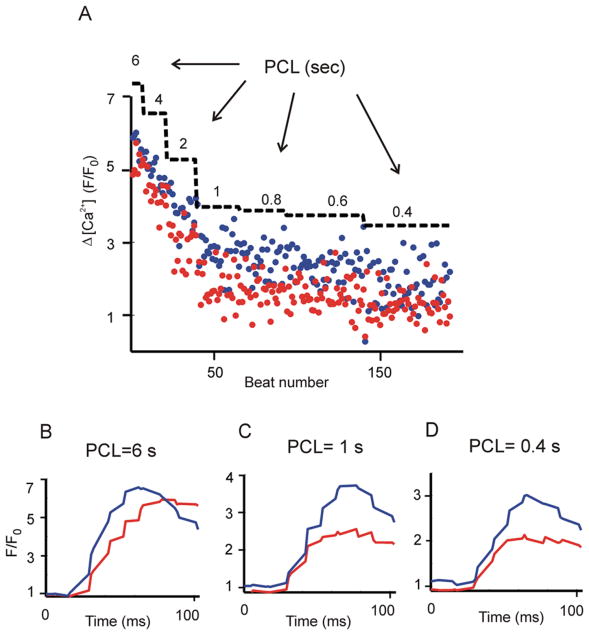
Figure 2.
Purkinje cells exhibit a negative Δ[Ca2+] versus frequency relationship. A single Purkinje cell was paced with a protocol in which the PCL was progressively decreased and Ca2+ transients resulting from each stimulation were recorded. (A) Local SSL Ca2+ transients recorded from two edges of a cell. Amplitudes (Δ[Ca2+]= Peak−diastolic [Ca2+]) calculated at the two SSL regions are denoted by red and blue circles. PCLs are superimposed as a staircase to mark each cycle length regime. (B-D) Averaged SSL [Ca2+] transients at PCL= 6 s (B), 1 s (C), 0.4 s (D). All data were obtained at the same scan line in an individual cell.

