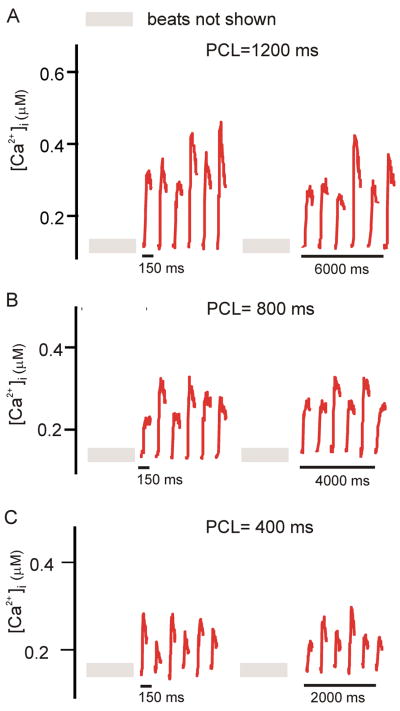
Figure 3.
Beat-to-beat variability in the local SSL persists with steady pacing. (A), (B), and (C), respectively, show SSL Ca2+ transients at PCL=1200, 800, and 400 ms. Each panel shows two sets of six consecutive Ca2+ transients, the first obtained after 29 stimuli, and the second obtained after 23 additional stimuli. At each PCL, variability in SSL Ca2+ transient amplitude persists.

