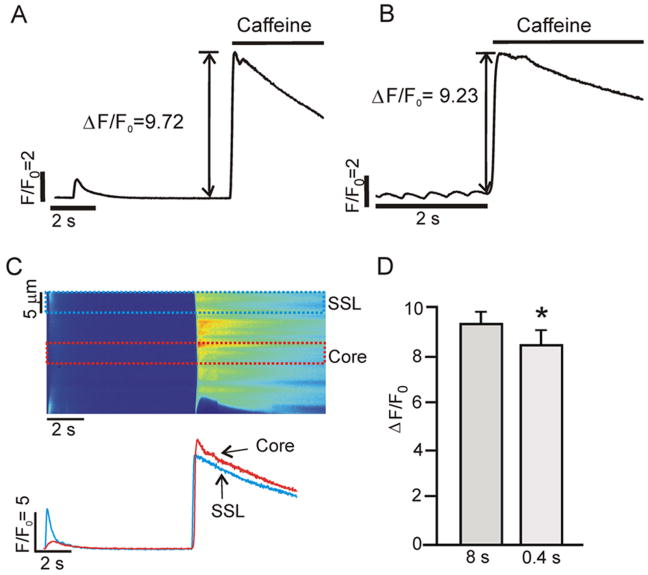
Figure 5.
SR Ca2+ load during slow and fast pacing. (A) Example showing the increase in cytosolic [Ca2+] produced by rapid application of 20 mM caffeine after pacing at PCL = 8s. (B) Increase in cytosolic [Ca2+] in the same cell after pacing at 0.4 s. (C) Space time image of the response to caffeine at PCL = 8 s (top), and SSL and core Ca2+ transients (5 μm average; bottom). (D) Pooled data (n=10 cells) illustrating that SR Ca2+ load, approximated as ΔF/F0 induced by 20 mM caffeine, is slightly lower at PCL = 0.4 s than at PCL = 8 s (8.41 ± 0.63 versus 9.30 ± 0.52; p = 0.03).

