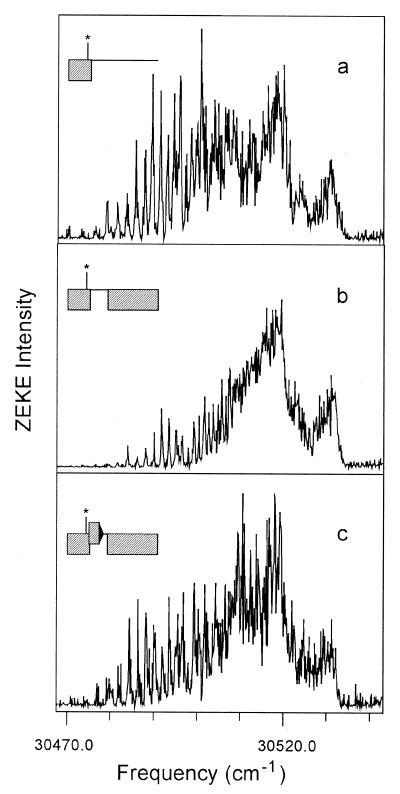
Figure 1.
An experimental ZEKE (pulsed-field ionization) spectrum plotted vs. the frequency ω1 of the second photon (see Fig. 2) for NO with three different configurations of weak (300 mV/cm) DC fields as shown. (a) The field Fℓ present only for 10 ns during excitation, indicated by an asterisk. (b) The field Fℓ is present during excitation and is switched off for several microseconds and switched on again. (c) The field Fℓ is present during excitation and is switched off and then switched on again. While the field Fℓ is off, the field Fm is switched on for 10 ns. See ref. 26 for more details about such experiments.

