
Figure 1.
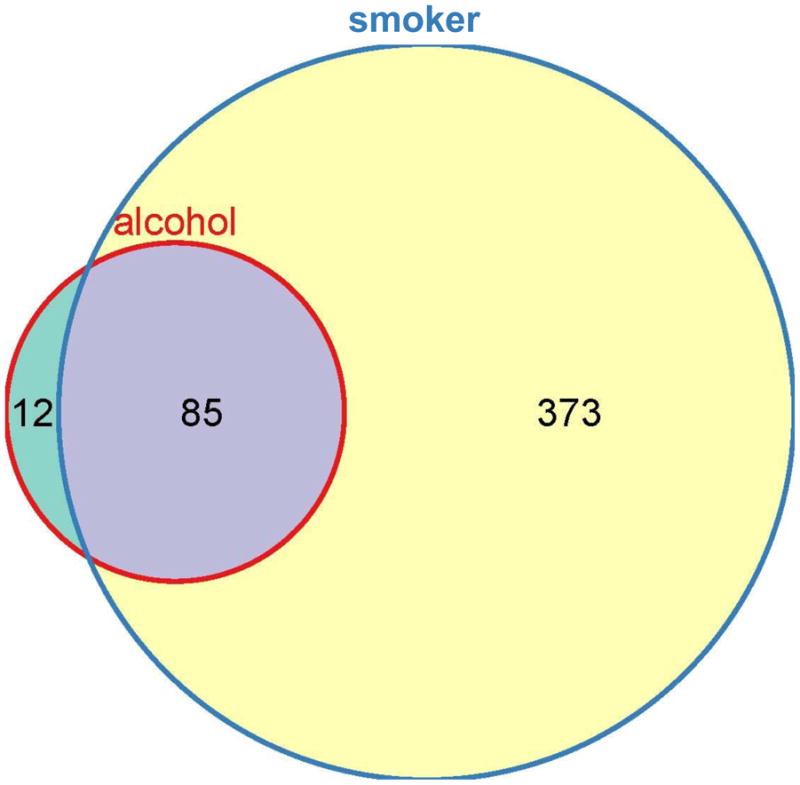
Venn diagram illustrating the relative contribution of alcohol use disorders (red circle) and smoking (blue circle) on differences in microarray gene expression in the test cohort. The test cohort consisted of 7 subjects with alcohol use disorders, and 7 pair-matched controls. Two-way ANOVA modeling was performed on both alcohol and smoking effects. The F statistics revealed 470 total differentially expressed probesets at FDR of 0.32. Further analysis showed that 373 of the 470 probesets were uniquely significant in smoking effects (79.4%, illustrated in yellow), while 12 of the 470 probesets were distinctly significant in alcohol effects (2.6%, illustrated in green). Among these 470, 85 (18.0%, illustrated in gray) probesets were common on both effects.