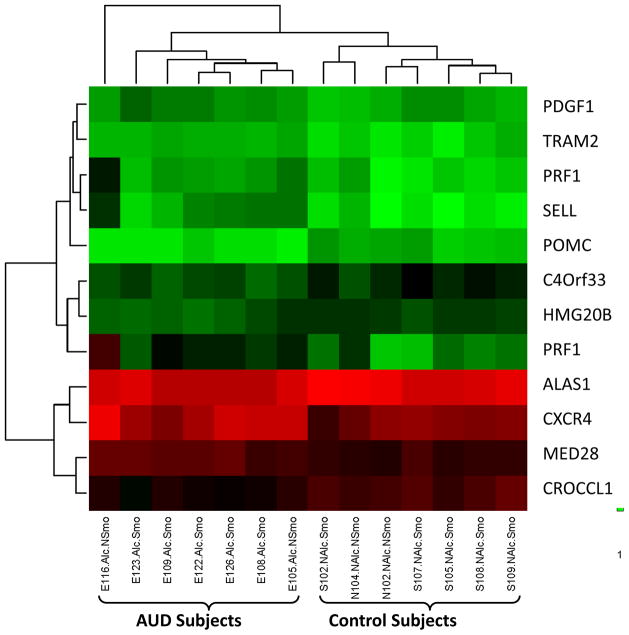
Figure 2.
Unsupervised hierarchical clustering image utilizing 12 probe sets determined by two-way ANOVA modeling with microarray data to be differentially regulated based on alcohol use disorders. Utilizing these probe sets in clustering analysis resulted in the subjects separating out into two groups that differed based on history of AUDs, regardless of smoking history. Gene symbols corresponding to each of these probes are listed on the right.

