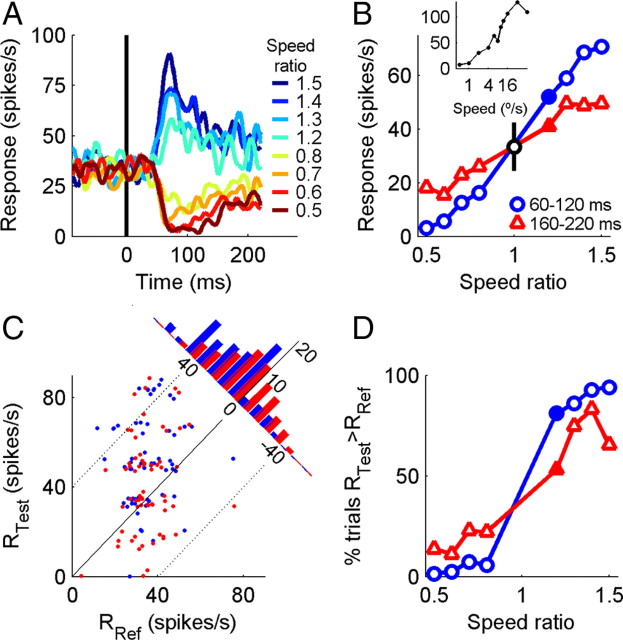
Figure 2.
Single-neuron responses during the task. A, Responses to 8 test speeds following a 12°/s reference, aligned on the time of the speed change. B, Speed tuning of the same neuron based on the averaging spike rate 60–120 ms and 160–220 ms after the change. SEs were smaller than the data markers. Black data point at speed ratio 1 shows the mean ± SD of the reference response (0–300 ms before speed change). Inset shows the speed tuning measured during passive fixation, 60–120 ms after motion onset. C, Distribution of single-trial test and reference responses, for trials with the speed ratio 1.2 (filled points in B). Diagonal lines indicate rate differences of −40,0 and 40 spikes/s. Histogram shows the distribution of difference firing rates (RTest − RRef). Overall, test firing rate is greater than reference on 81% (blue) and 53% (red) of trials. For clarity, points have been randomly jittered by Gaussian noise, μ = 3 spikes/s. D, Neurometric tuning, given by the percentage of trials in which the test firing rate was greater than the reference firing rate.

