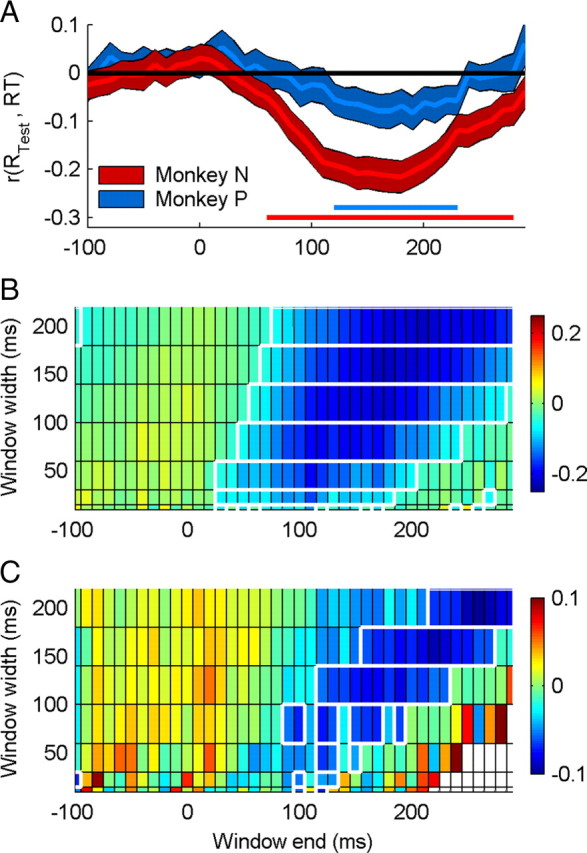
Figure 6.

Correlation between reaction time and spiking rate, in sliding time windows of variable width. A, Mean ± SEM correlation, for windows of width 120 ms, ending from −100 to 300 ms relative to the time of the speed change. Horizontal lines indicate the time windows in which the mean correlation was significantly <0. B, C, Mean correlations for monkey N (B) and monkey P (C) are shown for window widths 10–200 ms. White outlined regions indicate time windows in which the mean correlation was significantly <0. Solid white regions in the lower right of C indicate time windows in which there were no neurons with sufficient trials to calculate the correlation. This occurred because some trials had reaction times <300 ms.
