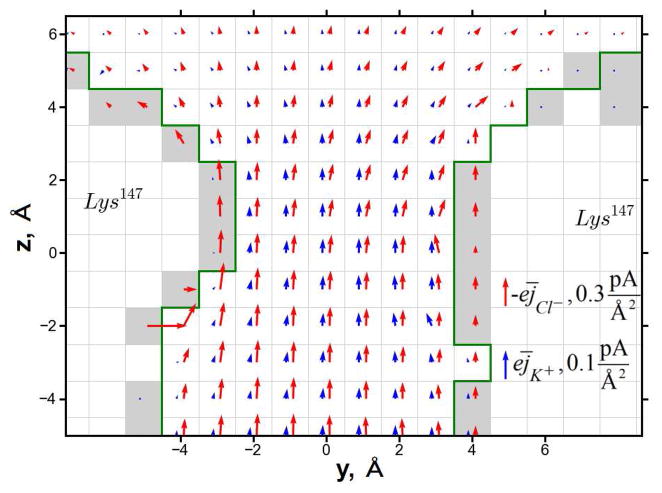
Figure 7.
2D slice through the main constrictions of current flux as calculated by PNP-SR-MD. The current flux of K+ is shown by blue arrows and that of Cl− by red arrows. Because the flux of K+ is several times smaller than Cl− the current flux of K+ and Cl− are scaled differently (see right bottom part of the figure). Green line shows the border of IAV as determine by HR; grey area highlight the difference of IAV between PNP-HR and PNP-SR-MD.

