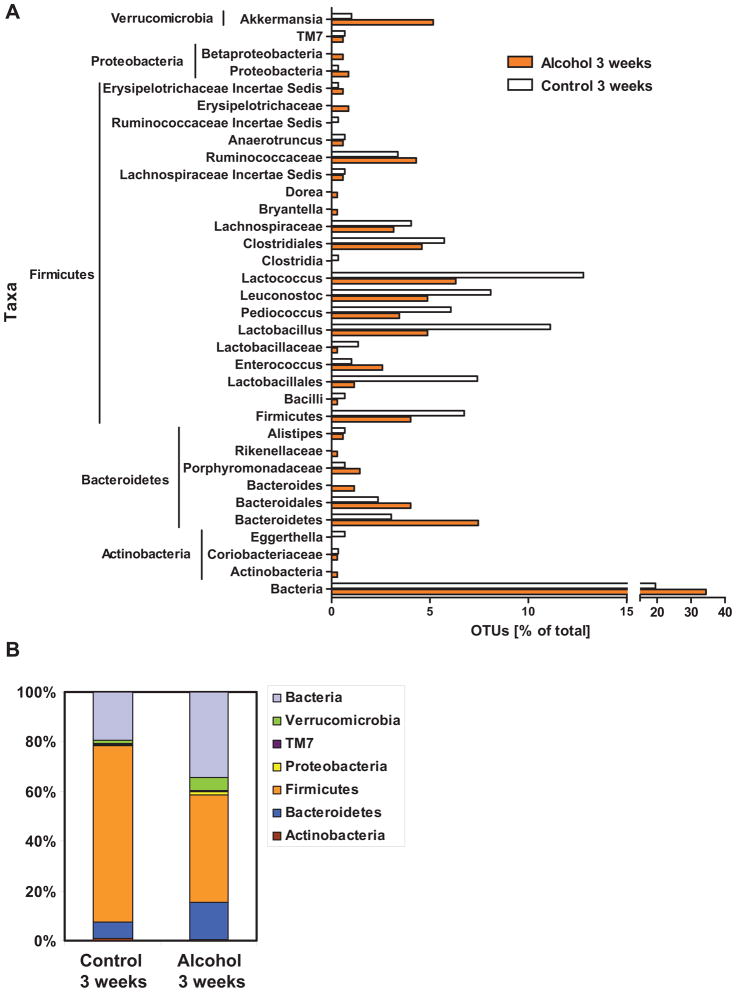
Figure 4. Effects of alcohol on microbial diversity of the mouse cecum.

(A) 16S rRNA from the mouse cecum was sequenced using 454 Titanium technology. Experiment-specific OTU representative sequences (97% identity) were classified using the Ribosomal Database Project (RDP) classifier and plotted. Orange bars indicate OTUs containing the alcohol treated group (3 mice, distributed among 349 OTUs) and white bars indicate OTUs containing the isocaloric control group (3 mice, distributed among 297 OTUs). (B) The graph demonstrates the percentages of each community contributed by the indicated phyla. (C) Scatter plots of Unifrac (left) and R (right) PCA. The alcohol treated samples are in blue while the isocaloric control samples are in red.

