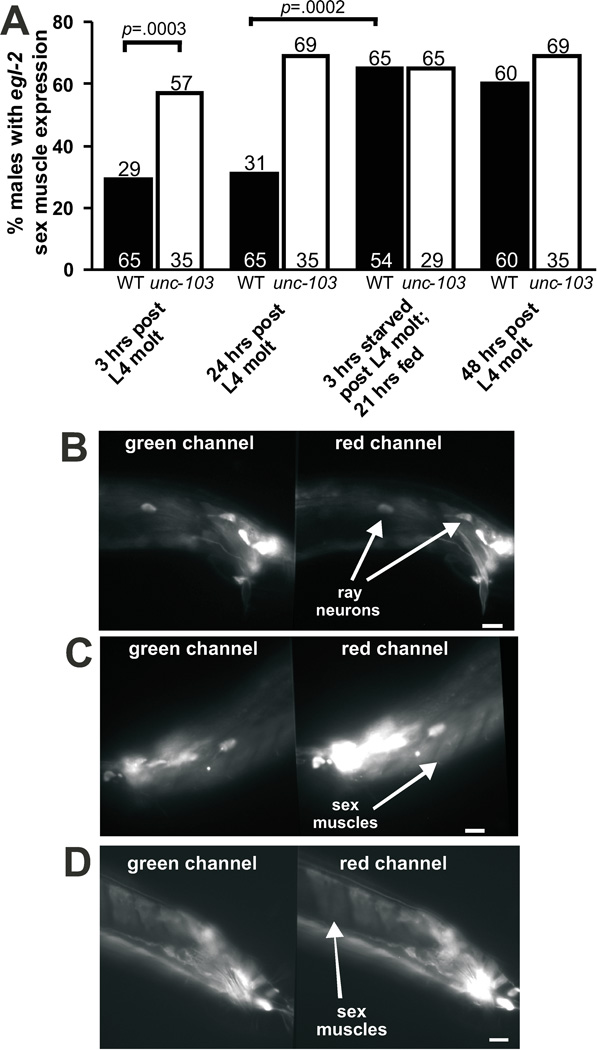
Figure 2.
egl-2 promoter expression in sex muscles increases after transient starvation. (A) Percentage of males with visible DsRed1-E5 fluorescent protein expression in the male sex muscles. The black and white bars represent the percentage of wild-type (WT) and unc-103(0) males that express DsRed1-E5 in their sex muscles, respectively. The values within and above the bars correspond to the number of males assayed and the percentage values, respectively. Fisher’s exact test was used to calculate statistical significance. (B)–(D) Fluorescence images of wild-type adult male tails. The left and right panels show fluorescence in the green and red channels, respectively. Scale bars depict 10 micrometers. (B) 24 hr adult male tail. egl-2 promoter expression of DsRed1-E5 is seen mainly in the male ray neurons. (C) 48 hr adult male tail. egl-2 promoter expression of the DsRed1-E5 can now be seen in male sex muscles in addition to the ray neurons. (D) 24 hr adult male tail where the male was starved for three hours after L4 molt. egl-2 promoter expression of DsRed1-E5 can be seen in male sex muscles.

