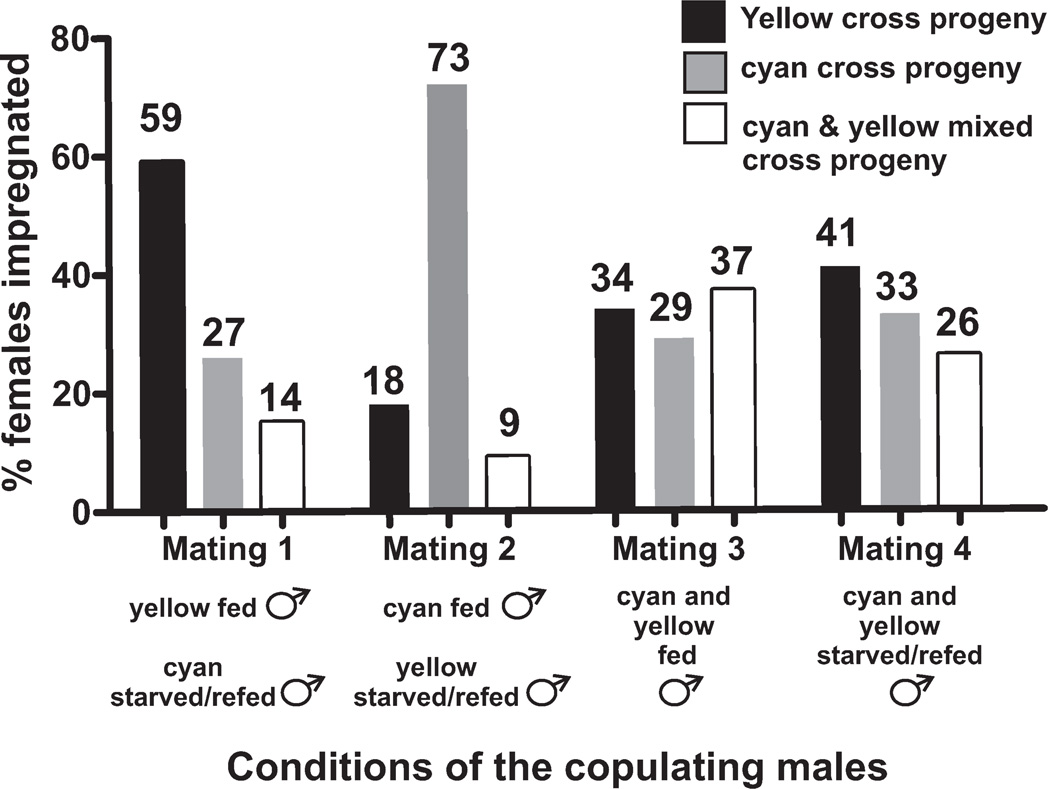
Figure 4.
Competition mating assay. The y axis indicates the percentage of fog-2 females impregnated by a well-fed male, a starved/re-fed male or both. The x axis indicates whether the males tested were one-day-old males fed for 23 hrs or one-day-old males that were starved for 20 hrs and then re-fed for 3 hrs. Black bars represent females that produced cross progeny only containing a yellow fluorescent protein (YFP) transgenic marker, grey bars represent females that produced cross progeny only containing a cyan fluorescent protein (CFP) transgenic marker, and white bars represent females that produced mixed cross progeny that contain either markers. Numbers at the top of the bars are the measured percentages. Mating competitions 1, 2, 3 and 4 involved 34, 33, 62, and 66 females, respectively.

