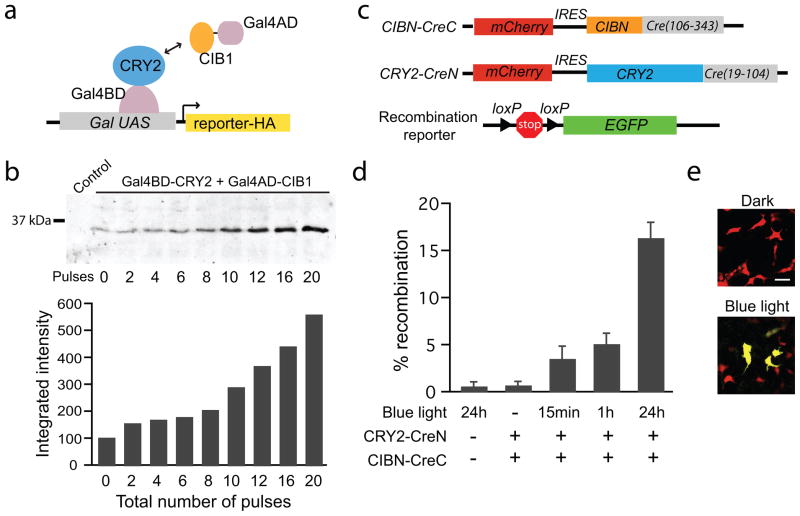
Figure 3.
Light induced activation of transcription and DNA recombination. (a) Schematic showing split Gal4 modules (Gal4BD-CRY2 and Gal4AD-CIB1) expressed in yeast cells containing an HA-tagged reporter protein under control of a galactose-inducible promoter. (b) Immunoblot analysis of the HA-tagged reporter (top panel) in response to blue light pulses (10 s pulses, 1.7 mW, 8 min apart). The control lane contains lysates from cells expressing only the reporter. The graph at bottom shows the quantification of western blot bands. (c) Schematic showing the two split Cre constructs (CIBN-CreC and CRY2-CreN) and the Cre reporter. (d) The plot shows % Cre reporter recombination (# GFP expressing cells / # mCherry expressing cells) measured 48 hours after transfection of HEK293T cells with the Cre reporter and indicated constructs. Cells were exposed to blue light pulses (450 nm, 4.5 mW) for indicated times (15 min, 1 hr, or 24 hrs), or kept in the dark for the duration (−). The error bars represent standard deviation for 3 samples from 3 independent experiments. (e) GFP fluorescence images from samples containing both CRY2-CreN and CIBN-CreC that were exposed to 24 hours of blue light or dark. Scale bar 20 μm.

