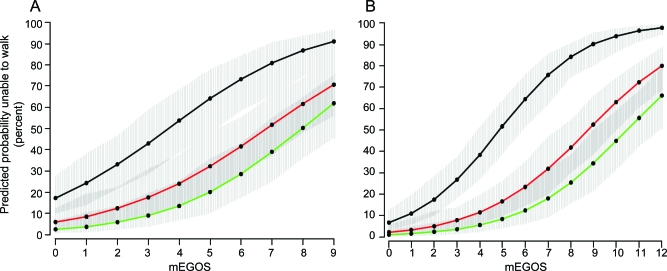
Figure 1. Predicted fraction of patients unable to walk independently according to modified Erasmus GBS Outcome Score (mEGOS).
Predicted fraction of patients unable to walk independently at 4 weeks (black lines), 3 months (red lines), and 6 months (green lines) on the basis of the mEGOS at hospital admission (A) and at day 7 of admission (B). The gray areas around the colored lines represent 90% confidence intervals.

