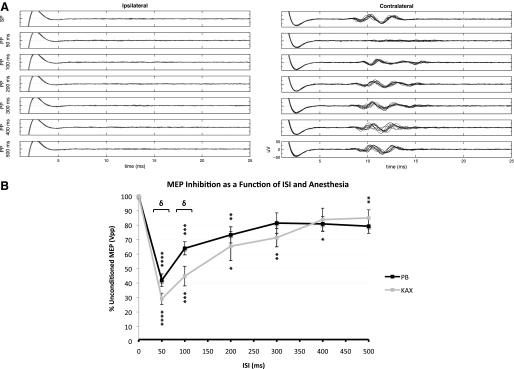
Fig. 2.
Long interval intracortical inhibition (LICI) in rats. A: MEPs elicited by spTMS (top row; SP) and paired-pulse TMS (ppTMS, rows 2–7; PP). Left and right: ipsi- and contralateral EMG from the brachioradialis muscle, respectively. Intercolumn comparison demonstrates robust lateralization of MEPs. Rows 2–7 correspond to ppTMS with interstimulus intervals (ISIs) of 50, 100, 200, 300, 400, and 500 ms, respectively. Note the near complete inhibition seen at an ISI of 50 ms with diminishing inhibition seen for longer ISIs. Overall findings for LI-ppTMS in rat match the phenomenon of human LICI with the same ppTMS paradigm. Tracings include 10 superimposed stimulus trials. Conditioning stimulus (CS) and test stimulus (TS) were both set to 120% MT. B: conditioned MEP size as function of anesthetic and ISI. The graph shows the conditioned MEP peak-to-peak amplitude normalized to unconditioned MEP peak-to-peak amplitude, expressed as the percent of unconditioned MEP Vpp. All values >100% represent signal facilitation while values <100% represent inhibition. CS and TS were set to 120% MT. 10 stimulus trials for each condition were run on 7 rats for each anesthetic (total = 70 signals per condition per anesthetic) with the exception of 300, 400, and 500 ms ISIs in the PB group for which 4 rats were used. Data points marked with asterisks achieved significant inhibition relative to baseline unconditioned MEP values (*P < 0.05, **P < 0.02, ***P < 0.002, ****P ≤ 0.0002). Bracketed ISIs denote significant intergroup differences among anesthetics (δ <0.05). Values denote means ± SE.

