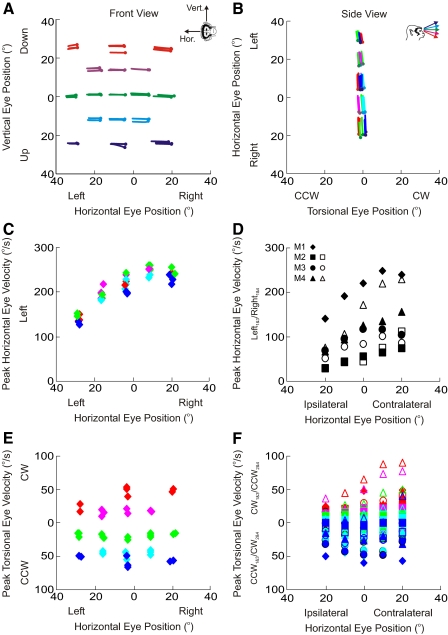
Fig. 1.
Properties of stimulation-induced eye movements. A and B: effects on eye position. Spatial plots of eye movements produced by left abducens nerve stimulation in one monkey (M1) from both front (A) and side (B) perspectives. The inset in A indicates the axes of rotation for horizontal and vertical eye movements according to the right-hand rule; the inset in B indicates color scheme for vertical eye positions (blue = 20° up; cyan = 10° up; green = center; magenta = 10° down; red = 20° down) and circles indicate initial eye position. Note that the small vertical eye-position–dependent changes in torsion seen in B are due to vergence-dependent changes in Listing's plane (Mok et al. 1992) (see methods). C and D: effects on horizontal eye velocity. Peak horizontal eye velocity for one monkey (C: data shown for each stimulation trial) and across all monkeys (D: data shown represent averages across all horizontal eye positions) is larger for contralateral than that for ipsilateral eye positions. E and F: effects on torsional eye position. Peak torsional eye velocity for one monkey (E: data shown for each stimulation trial) and across all monkeys (F: data shown represents averages across all trials at each horizontal/vertical eye position combination) has opposite signs, depending on vertical eye position. Note that to compare data across all animals, directions on the ordinate in D and F are monkey specific, depending on whether the left or right abducens nerve was stimulated. Different symbols are used to indicate the 4 monkeys (see inset in D). Three of the 4 monkeys had 2 data sets (filled and hollow symbols).

