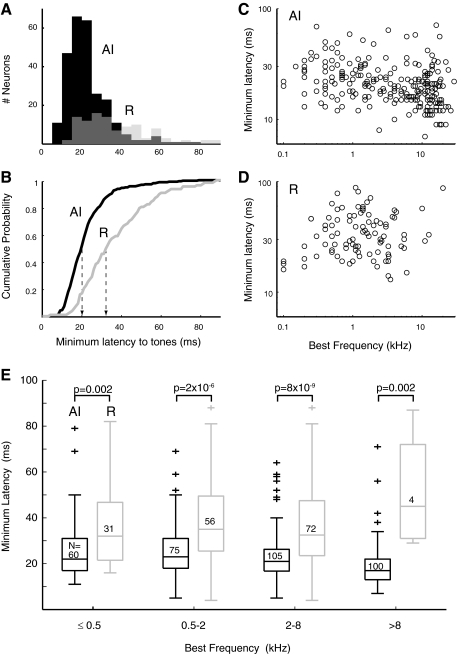
Fig. 8.
Minimum response latency to tones is longer in the rostral field, and short latencies are weakly correlated with higher BFs. Minimum response latencies in AI and R as overlaid histograms (A) and cumulative probability functions (B). Median latencies (indicated by - - -) are 20 ms in AI (n = 265) and 33 ms in R (n = 107), a difference of 13 ms (P = 4.2 × 10⁻¹⁷). Linear regression analysis of minimum latency against BF (C and D) confirms that latencies are shorter at higher BF in AI (P = 0.0001), but this was not significant in R. E: the difference in minimum latency between AI and R was significant across frequency. Boxes indicate median and quartiles, crosses mark outliers, sample size is indicated inside each box, and P values are from a Wilcoxon rank-sum test.

