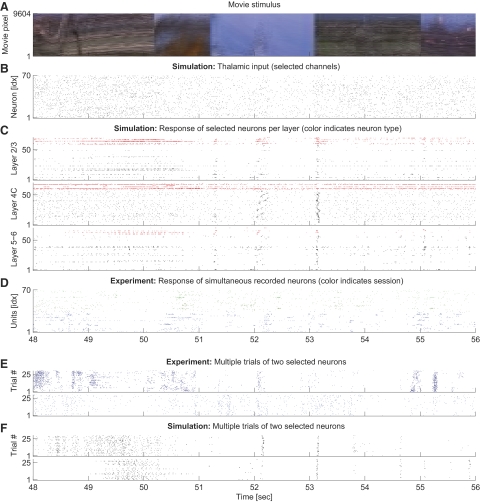
Fig. 2.
Spiking response to movie stimulus in model simulation and in vivo. A: movie input to the model circuit in true colors (in the model, we used a grayscale version of this movie). Pixels of the movie frames are lined up vertically. B: lateral geniculate nucleus (LGN) model response to the movie in A. Seventy input channels were randomly selected for plotting (in total, there are 4,900 LGN inputs). C: spike trains elicited by neurons in the V1 model in response to the LGN output from B are plotted in separate panels for each of the layers 2/3, 4C, and 5–6. For better visualization, 70 neurons (of 11,532) are randomly chosen from each layer. Inhibitory and excitatory neurons are colored red and black, respectively. One notes a high variability in the statistical structure across neurons. D: spike trains of the spike sorted experimental data in response to the same movie segment are shown. Different colors represent different sessions of the same monkey—green (blue): 2 trials of session d04nm1 (d04nm2). We show 2 trials to allow for an easier comparison of the statistical structure of the spike trains in vivo with the model response (C). Note that the receptive field of some electrode channels lie outside of the depicted movie region of A. E and F: Multiple trials of 2 selected neurons in experiment (E) and model (F). Note that trial-to-trial variability is comparable in silico and in vivo.

