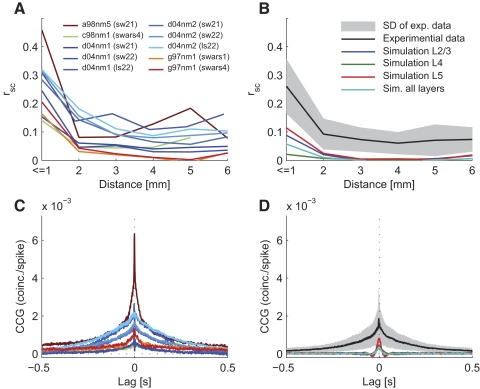
Fig. 8.
Correlation structure in the model and in vivo. For better comparability with literature values, correlations were plotted in terms of noise correlations (A and B) and shift-corrected cross-correlograms (CCG; C and D). Sessions of experimental data were plotted as in Fig. 2 (A and C). B and D: the corresponding statistics calculated on the model response (for optimized parameter settings). Correlation structure in the model response were calculated on each layer separately showing a systematic difference in the strength of correlation in each layer (no layer information was available for the in vivo data), Correlations in the model were generally lower than in the in vivo data.

