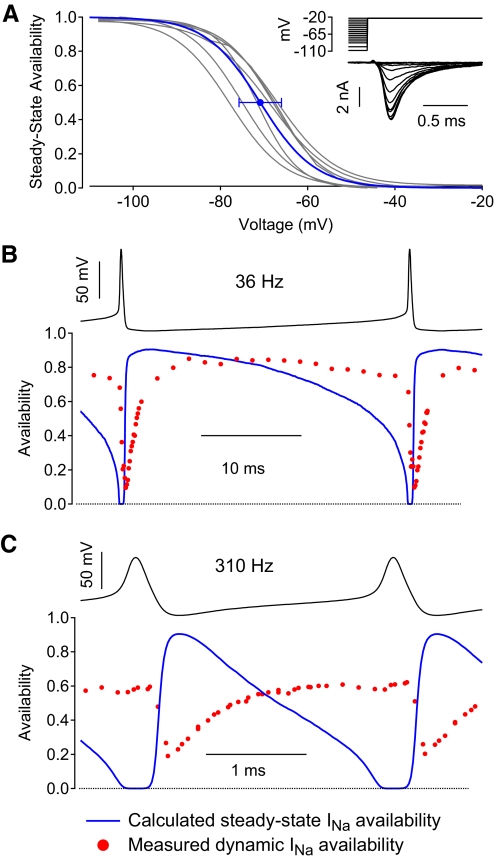
Fig. 11.
Comparison of measured instantaneous availability with predicted steady-state sodium channel availability during firing cycles. A: steady-state availability was measured as a function of voltage at 37°C using 500-ms steps to various voltages followed by a test step to −23 mV. Inset shows example sodium currents from a typical neuron; 30 nM TTX was used to reduce the magnitude of sodium currents to controllable sizes. Gray traces show inactivation curves determined in each of 6 neurons. Blue trace is the Boltzmann curve corresponding to average midpoint and average slope from the 6 neurons; error bars indicate SD of the midpoints determined in individual neurons. B: measured availability (red circles) during the firing cycle during spontaneous firing compared with the steady-state availability (blue) calculated from the average curve in A. C: same for rapid, stimulated firing. Experimental measurements of availability in B and C are from cells shown in Fig. 9, B and H.

